First Analysis
This tutorial walks you through running your first ShieldCI security and quality scan, understanding the results, and fixing your first issues.
Prerequisites
- ShieldCI installed (Installation Guide)
- Laravel 9+ application
- 5-10 minutes
Step 1: Run Your First Scan
Open your terminal in your Laravel project root and run:
php artisan shield:analyzeWhat happens next:
- ShieldCI discovers your project structure (3-5 seconds)
- Parses PHP files into Abstract Syntax Trees (10-20 seconds)
- Runs 73 analyzers across 5 categories (20-30 seconds)
- Generates detailed report (2-5 seconds)
Total duration: 30-60 seconds for typical Laravel apps
Step 2: Understanding the Output
Terminal output
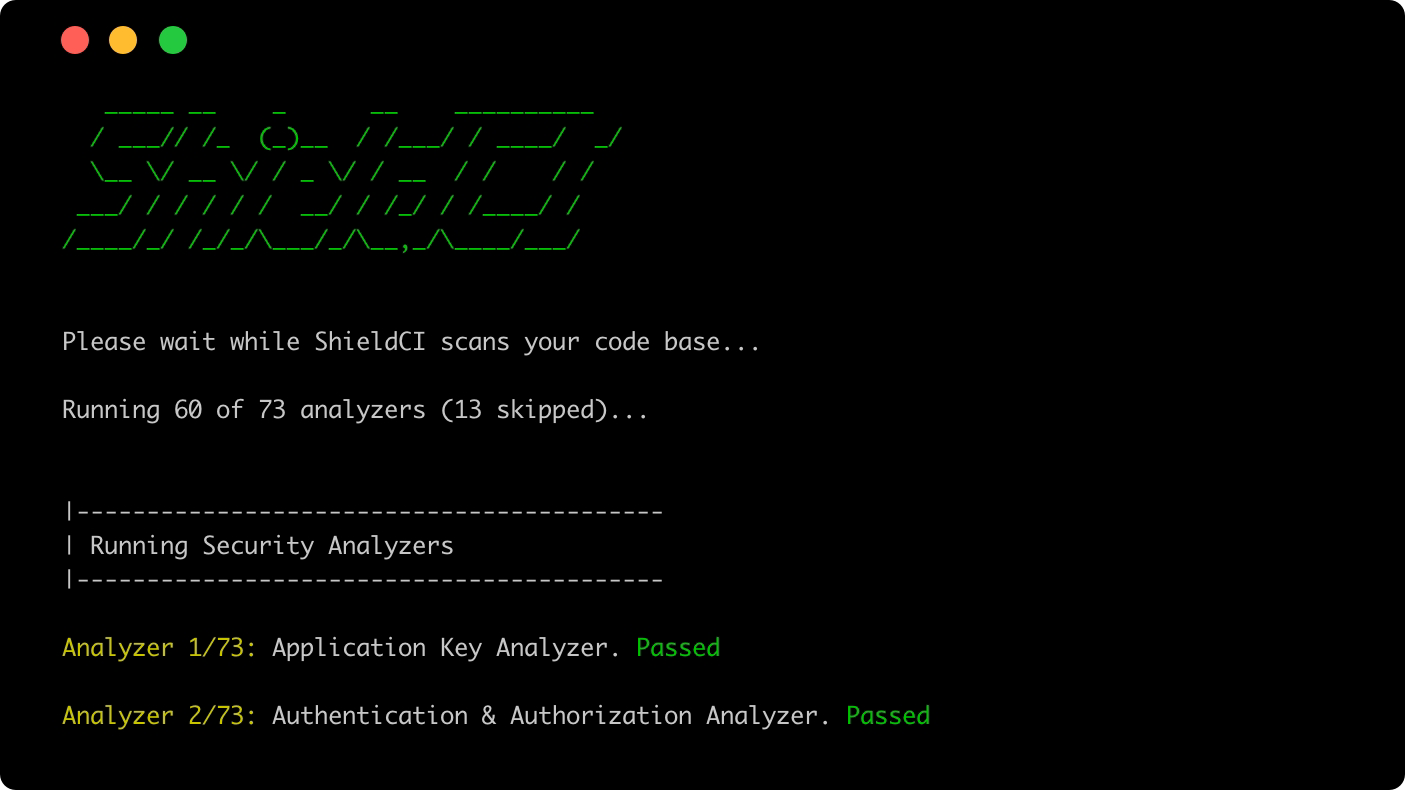
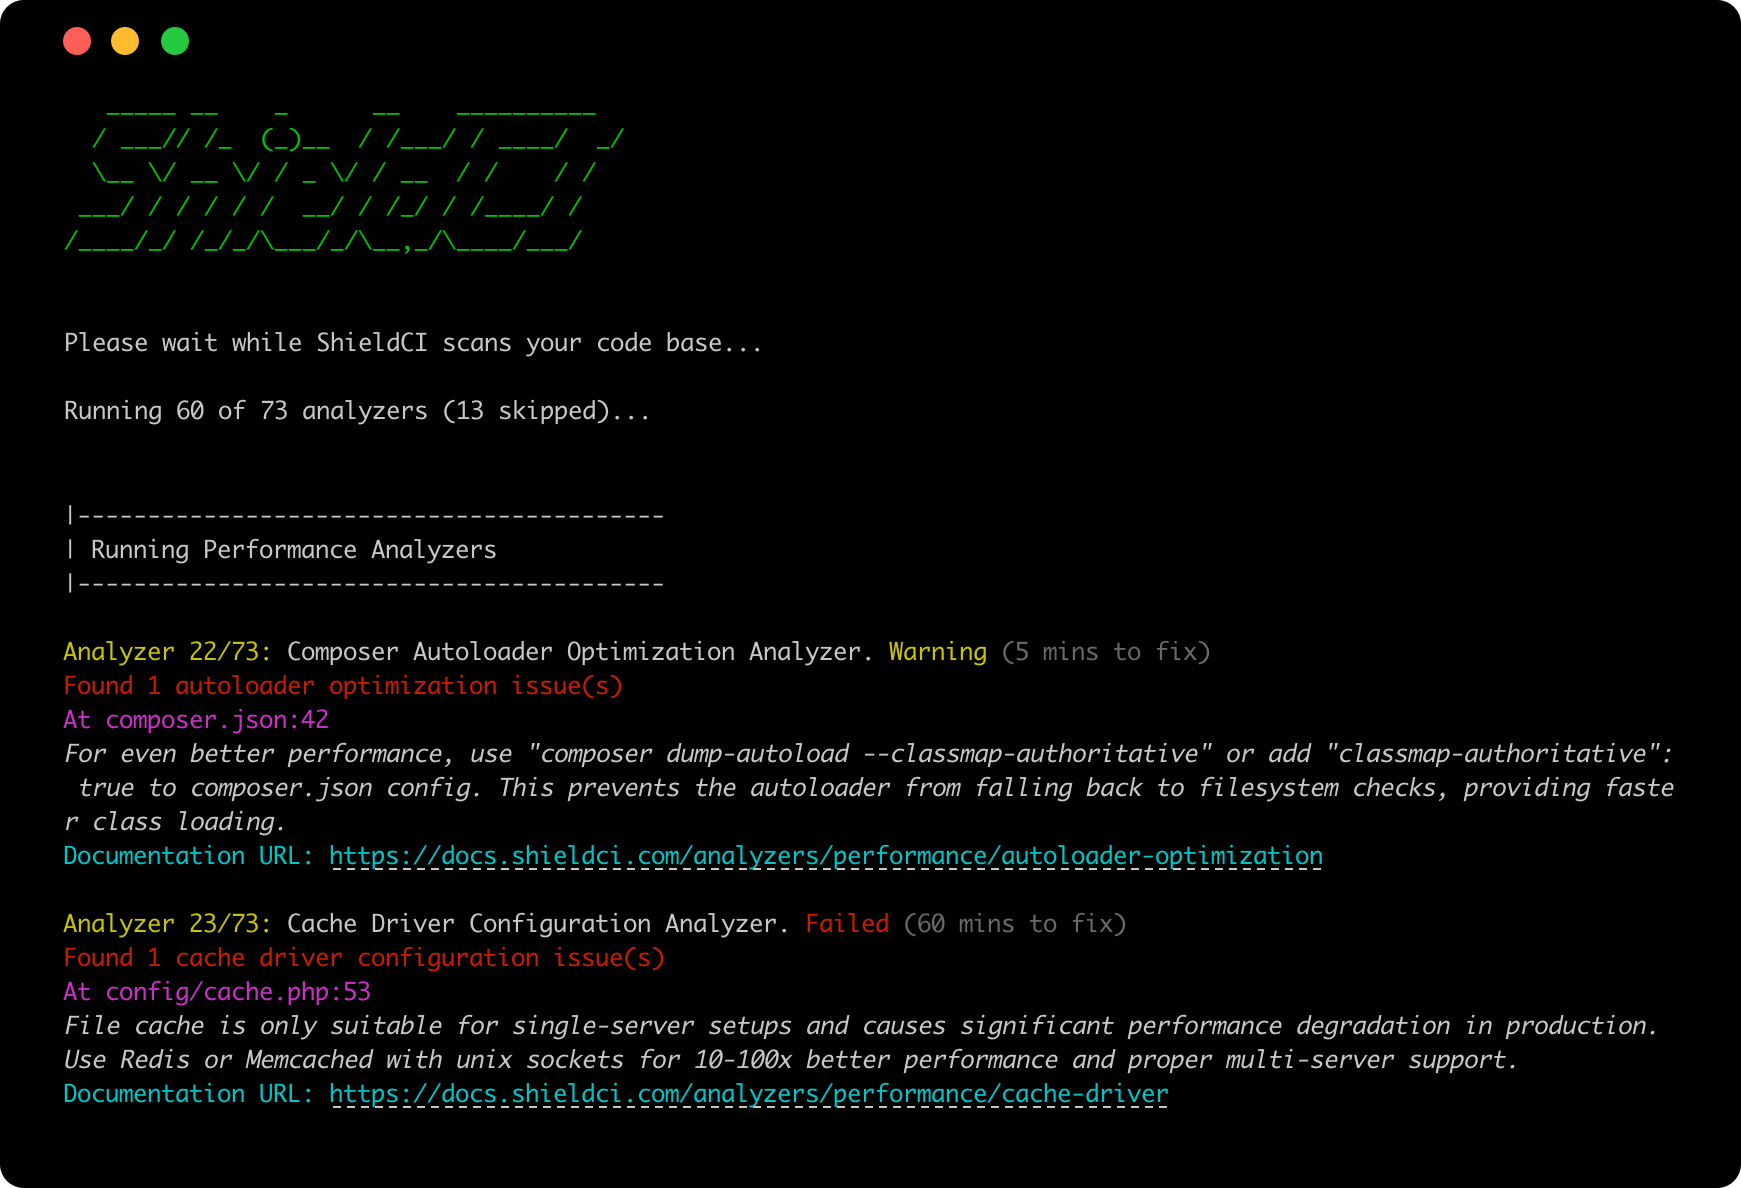
Failed Checks
All checks that fail will include a description of why they failed along with the associated lines of code (if applicable).
Report Card Summary
After displaying all issues, ShieldCI shows a Report Card with analyzer results grouped by category:
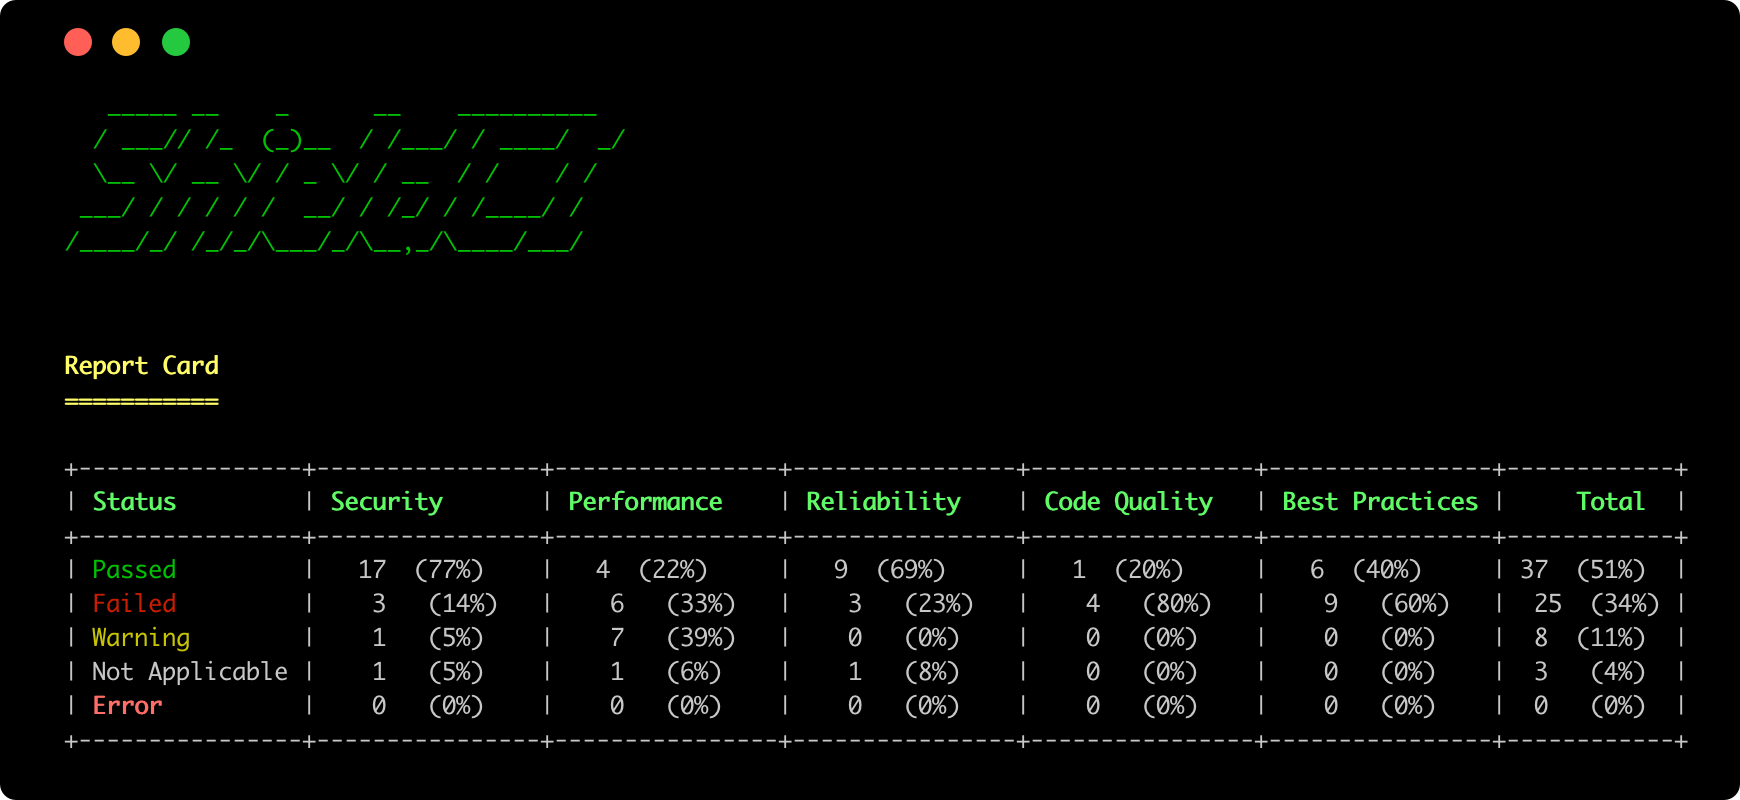
Understanding the Report Card:
- Passed: Analyzers that found no issues
- Failed: Analyzers that found Critical or High severity issues
- Warning: Analyzers that found Medium or Low severity issues
- Not Applicable: Analyzers skipped because they don't apply to your project (e.g., MySQL analyzer when using PostgreSQL)
- Error: Analyzers that encountered exceptions during execution
Exit Codes
ShieldCI returns exit codes for CI/CD integration based on the fail_on configuration (default: 'high'):
Exit Code 0 (Success):
- No issues above the configured severity threshold
- OR
fail_onis set to'never' - AND score is above
fail_threshold(if configured)
Exit Code 1 (Failure):
- Issues found at or above the configured severity threshold
- OR score is below
fail_threshold(if configured)
Severity Thresholds:
Configure which severity levels trigger build failures:
fail_on Value | Fails On | Use Case |
|---|---|---|
'never' | Never fails | CI runs for reporting only |
'critical' | Critical issues only | Legacy codebases with many High issues |
'high' ⭐ | High + Critical issues | Recommended default (matches Failed status) |
'medium' | Medium + High + Critical | Strict quality standards |
'low' | Any issues (all severities) | Zero-tolerance quality enforcement |
Consistency Note
Analyzers mark both High and Critical issues as "Failed" status in the report. Using fail_on='high' (default) ensures consistency between what appears as "Failed" in the report and the actual build exit code.
If you set fail_on='critical', you may see High severity issues marked as "Failed" in the report, but the build will still pass (exit code 0).
Configuration:
Set in config/shieldci.php or via environment variables:
// When should analysis fail?
'fail_on' => env('SHIELDCI_FAIL_ON', 'high'),

// Minimum score to pass (0-100, optional)
'fail_threshold' => env('SHIELDCI_FAIL_THRESHOLD', null),Examples:
Progressive Quality Improvement
For legacy codebases, start permissive and tighten standards over time:
# Phase 1: Legacy codebases with many issues
SHIELDCI_FAIL_ON=critical

# Phase 2: Standard quality (recommended default)
SHIELDCI_FAIL_ON=high

# Phase 3: Strict quality standards
SHIELDCI_FAIL_ON=medium

# Phase 4: Zero-tolerance enforcement
SHIELDCI_FAIL_ON=lowYou can also combine with score thresholds:
# Require 80% pass rate AND no high/critical issues
SHIELDCI_FAIL_ON=high
SHIELDCI_FAIL_THRESHOLD=80Step 3: Understanding Analyzer Statuses
Each analyzer reports one of five statuses:
✅ Passed
No issues detected. The analyzer completed successfully and found no problems.
❌ Failed
Critical or High severity issues detected. These require prompt attention.
Critical Issues - Security vulnerabilities that could lead to:
- Data breaches
- Account takeover
- Code execution
- Information disclosure
Examples: Debug mode in production, Missing CSRF protection, SQL injection, Exposed credentials
High Issues - Significant security or performance risks:
- Brute force attack vectors
- N+1 queries
- Vulnerable dependencies
- Missing auth checks
Examples: Login throttling disabled, Eager loading missing, Outdated packages with CVEs
⚠️ Warning
Medium or Low severity issues detected. Address when convenient.
Medium Issues - Best practice violations and optimizations:
- Missing cache configuration
- Deprecated API usage
- Code quality issues
Examples: Config not cached, Route caching disabled, Using deprecated methods
Low Issues - Optional improvements:
- Missing route names
- Documentation gaps
- Code style inconsistencies
Examples: Missing DocBlocks, Unnamed routes, Minor formatting issues
⊘ Not Applicable
Analyzer doesn't apply to your project configuration.
Examples:
- MySQL optimization analyzer when using PostgreSQL
- Horizon analyzer when not using Laravel Horizon
- Frontend dependency analyzer when no package.json exists
⚠️ Error
Analyzer encountered an unexpected error during execution. This typically indicates:
- Missing dependencies or configuration
- File permission issues
- Corrupted project files
Action: Check the error message and verify your project setup.
Step 4: Fixing Your First Issue
Let's fix the Debug Mode critical issue step-by-step.
Current State (Vulnerable)
File: config/app.php
'debug' => env('APP_DEBUG', true), // ❌ Defaults to true.env:
APP_DEBUG=true # ❌ Debug enabledProblem: Stack traces expose sensitive data in production.
Fix Step-by-Step
1. Update production environment file:
# Edit .env
nano .env2. Change debug setting:
# BEFORE
APP_DEBUG=true

# AFTER
APP_DEBUG=false
LOG_LEVEL=error3. Clear config cache:
php artisan config:clear
php artisan cache:clear4. Re-run ShieldCI to confirm:
php artisan shield:analyzeExpected output:
✅ Debug Mode Analyzer: PASSED
No issues found in config/app.phpFixed State (Secure)
File: config/app.php
'debug' => env('APP_DEBUG', false), // ✅ Defaults to false.env:
APP_DEBUG=false  # ✅ Debug disabled
LOG_LEVEL=error
LOG_CHANNEL=stackResult: Production errors logged securely without exposing sensitive data.
Step 5: Fixing Login Throttling
Let's fix the Login Throttling issue.
Current State (Vulnerable)
File: routes/web.php
Route::post('/login', [LoginController::class, 'login']); // ❌ No throttleProblem: Attackers can try unlimited password combinations.
Fix
Add throttle middleware:
Route::post('/login', [LoginController::class, 'login'])
->middleware('throttle:5,1'); // ✅ 5 attempts per minuteVerify the fix:
php artisan route:list --path=login -vExpected output:
POST   | /login.........................LoginController@login
         ⇂ web
⇂ Illuminate\Routing\Middleware\ThrottleRequests:5,1Re-run ShieldCI:
php artisan shield:analyzeExpected:
✅ Login Throttling Analyzer: PASSED
Rate limiting properly configured on authentication routesStep 6: Updating Vulnerable Dependencies
Let's fix the Vulnerable Dependency issue.
Current State
composer.lock shows:
{
  "name": "symfony/http-foundation",
  "version": "v6.0.1"  // ❌ Vulnerable
}Fix
1. Update the package:
composer update symfony/http-foundation2. Verify the update:
composer show symfony/http-foundationExpected output:
name     : symfony/http-foundation
version : v6.0.8 // ✅ Fixed version3. Re-run ShieldCI:
php artisan shield:analyzeExpected:
✅ Vulnerable Dependencies Analyzer: PASSED
No known vulnerabilities in Composer dependenciesStep 7: Export Results
JSON Export (for automation)
php artisan shield:analyze --format=json > results.jsonUse in scripts:
# Check if critical issues exist
CRITICAL=$(cat results.json | jq '.summary.critical')

if [ $CRITICAL -gt 0 ]; then
    echo "❌ Critical issues found - blocking deployment"
    exit 1
fiJSON Report Export
php artisan shield:analyze --format=json --output=report.jsonThis exports a structured JSON file containing:
- Complete analysis results
- Issue details and metadata
- Summary statistics
- Analyzer information
Step 8: Continuous Monitoring
Schedule Regular Scans
File: app/Console/Kernel.php
protected function schedule(Schedule $schedule)
{
    // Daily security scan
    $schedule->command('shield:analyze --format=json')
             ->daily()
             ->at('02:00')
             ->emailOutputOnFailure('security@company.com');

    // Weekly comprehensive scan
    $schedule->command('shield:analyze --format=json')
             ->weekly()
             ->mondays()
             ->at('09:00');
}CI/CD Integration
GitHub Actions (.github/workflows/shieldci.yml):
name: Security Analysis

on: [push, pull_request]

jobs:
  security:
    runs-on: ubuntu-latest
    steps:
      - uses: actions/checkout@v3

      - name: Setup PHP
        uses: shivammathur/setup-php@v2
        with:
          php-version: 8.1

      - name: Install Dependencies
        run: composer install --no-dev

      - name: Run ShieldCI
run: php artisan shield:analyze --format=jsonThis runs ShieldCI on every commit, blocking merges if critical issues are found.
Next Steps
Now that you've run your first analysis and fixed some issues:
- Configuration - Customize analyzer behavior
- Analyzers Reference - Understand each analyzer in depth